It’s always fun to experience, and write about, big wins, like a 918% increase in revenue, or a 350% boost in list growth, or a 100% increase in site traffic.
It would nice if every test delivered that, but that’s not the case. Here’s the thing: if you can earn a lift of 10% on every test and apply each learning before you do your next test (with your next 10% lift), after 9 sends that’s more than a 100% increase (with compounding). So, while the big wins are exciting, consistency is the real key to success. Test on a regular basis, keep applying what you learn to future sends, and you’ll be moving your results in the right direction.
This is the story of a very simple test – all we tested was a different subject line and preheader text. The end result was a 9% boost in revenue-per-thousand-emails sent (RPME). Not a bad lift for something that didn’t cost much of anything. And since we used a formulaic approach for the test, we can apply the learnings on many future emails that we send, increasing the value even more.
To reiterate: the only change we made to the test creative was the subject line and the preheader text. Everything else remained the same.
This is a sale email – everything featured in the email is on sale, up to 50% off. Our business goal is to generate revenue.
The client resends this email often, with different products, whenever there is a sale. So, the results of this test will continue to benefit the client on an ongoing basis.
The control subject line was “Holiday Gifts SALE!”
The control preheader text was “Great prices for some of our favorite holiday picks!”
A few hypotheses/ideas drove the development of the test creative. They are:
- If the savings are significant, including a dollar or amount off in the subject line can often boost performance
- Making the subject line and preheader more benefit-oriented will often boost performance
- Including the key copy in the first 25 characters of the subject line and preheader text will often boost performance, as this is all you can guarantee the reader will see.
Using these as a foundation, I went to work to craft test subject line and preheader copy. Here’s where I ended up:
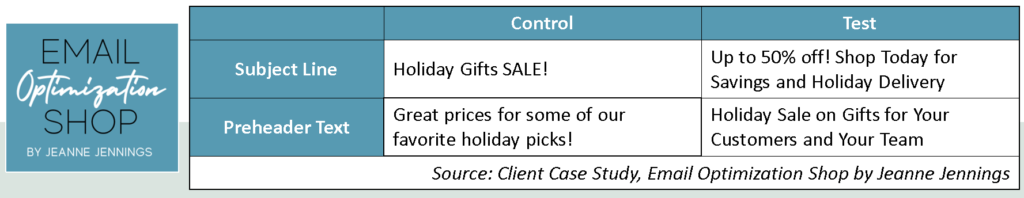
The test creative met all the hypotheses list above.
And the results of the test showed that the changes we made resonated with the audience.
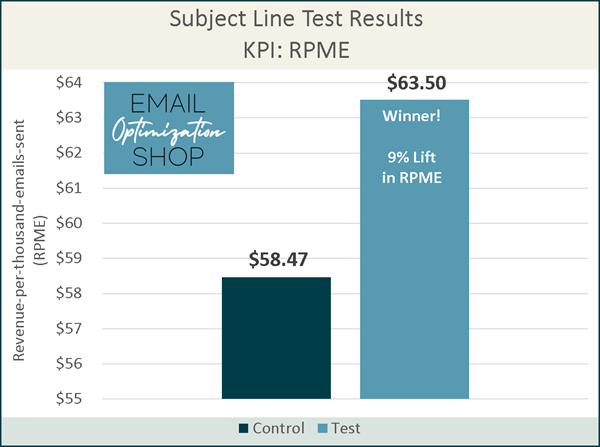
Revenue-per-thousand-emails-sent (RPME) is a version of my favorite revenue-per-email-sent (RPE) metric. When the RPE calculation returns values below $1.00, I like to shift to RPME. The variance between the two amounts remains the same with regard to percentage, but it’s easier to eyeball when you have larger numbers.
Many people use open rate as a key performance indicator (KPI) when they do subject line testing. This isn’t a good idea. This test was done in late 2020, before Apple’s Mail Privacy Protection (MPP) was launched, which has dramatically inflated open rates. But whether we’re talking pre- or post-MPP, open rates aren’t a good KPI when your goal is a direct sale.
It doesn’t really matter which version delivers a higher open rate; open rates aren’t a business metric. They are a diagnostic metric. You want to use a metric that reflects your end goal is for your KPI; in this case, we were looking to sell products, so our KPI for the test is RPME.
As you can see from the campaign data below, the control bested the test with regard to open rate. It’s a slim margin – 16.7% (control) versus 16.5% (test). In fact, the margin is so small that it’s within the margin of error – making it not statistically significant at a 90% or greater level. So, the open rate really tells you nothing. But the RPME tells you a lot.

Likewise, the click-through rate (CTR) isn’t a good measure of success or failure here. The control bested the test in CTR. This isn’t surprising based on analysis I’ve done in the past and written about; in my sample, the winning creative (KPI: RPE) only had the highest CTR 7% of the time.
We can, however, get some more insight into why the test beat the control by looking at the additional metrics.
The two key factors in RPE/RPME are the conversion rate (CR from Sent) and the average order value (AOV).
At the far right you can see the CR from Sent. This shows us what percentage of email recipients make a purchase. The test (0.020%) bested the control (0.012%) here by 66%. This is true even though a lower percentage of recipients clicked on the test email (35% less). This tells us that those who opened the test email were more highly motivated to buy than those who opened the control – which makes sense, since we featured the offer, a very nice ‘up to 50% off’ discount, front and center in the subject line.
Interestingly, the test lagged the control with regard to AOV, driving an average of $311 per sale, compared to $476 for the control.
So, the control had fewer buyers who spent more; the test had more buyers that spent less. Overall, the client generated more revenue from the test group, so that is the winner.
Apply these ideas on hypotheses and reporting with your next subject line test – and let me know how it goes!
Be safe, stay well, peace,
jj