For most organizations, older names on your list will perform less well than people that recently opted in to receive email from you. It’s something I call the honeymoon effect – newer people on your list are typically more excited to receive your email – and more likely to read and take action on it.
Here’s a case study showing that new subscribers open at a rate 48% higher than existing subscribers, and click at a rate 116% higher.
This client sends a monthly email newsletter; the primary goal is to engage readers and get them to click through to the website and interact with the content there. It’s a B2C audience, but this effect is not limited to B2C, newsletters, or email messages with non-revenue goals. It’s applicable no matter what your audience, type of email, or desired outcome (lead generation, direct sale, website traffic, etc.).
In this case study, new subscribers are defined as those receiving the newsletter for the first time. Existing subscribers are those who have received one or more previous issues. The differences in performance are dramatic; you can see it clearly in the chart below.
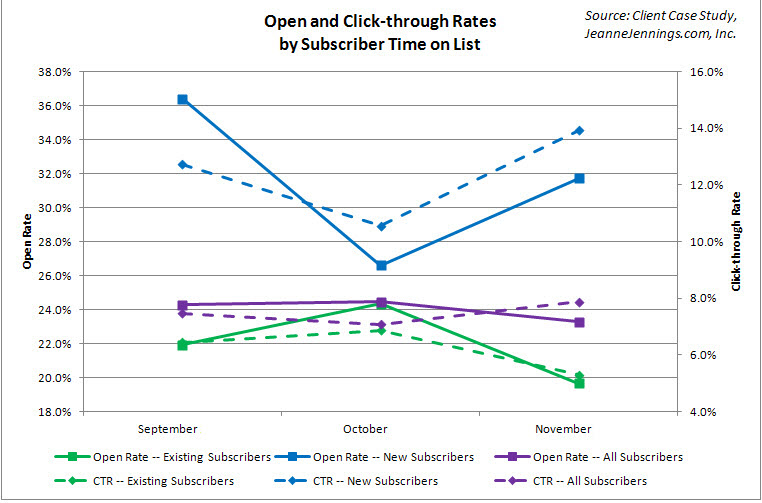
The most significant variance is in click-through rate. It was consistently in the double digits for new subscribers, while existing subscribers never showed a CTR above 6.9%. The average monthly variance during this period was over 100%, meaning that the new subscribers were twice as likely to click on a link in the email (see the data table below).
Open rates showed a similar relationship, although the magnitude was less. The average monthly variance here was just over 45%. In September, 36% of new subscribers opened the email, compared with just 22% of existing subscribers. While the variance was less in October (27% vs. 24%), it was still present.
The click-to-open rate (not on the chart above, but see the figures below in the data table), which isolates those that opened the email and shows us how many of this group clicked on a link, also shows a variance of more than 40%. So even if the open rates for the two groups had been equal, 40% more of the new subscribers would have clicked.
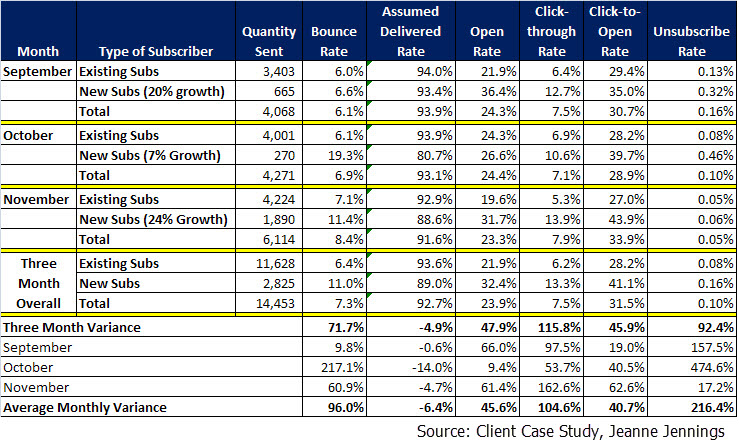
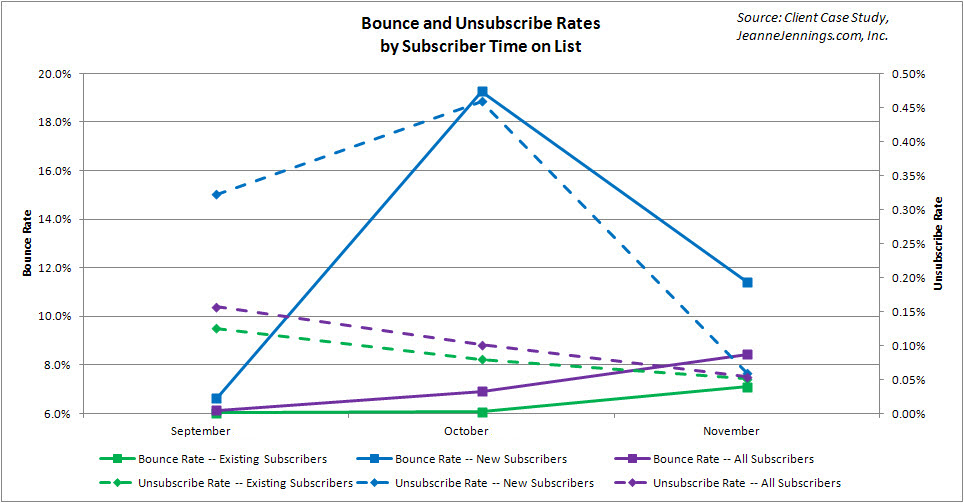
We also saw variances in bounce and unsubscribe rates (see the chart below).
The new subscribers registered a higher bounce rate than existing subscribers. It was significantly higher in October (over 200%), which we will be investigating. But even in September the variance was still 10%.
New subscribers, while more engaged with the newsletter, were also more likely to unsubscribe after they reviewed the first issue. New people unsubscribed at an average rate more than 200% higher than existing subscribers. While the variance was lowest in November (17%), it was still there.
Now let’s take a closer look at November. List growth increased significantly; 24% vs. just 7% in October and only 20% in September. And the raw number of new people added to the list was nearly three times that of September and about six times the number added in October.
When you see sudden list growth of this magnitude, it’s not unusual to find that, as a group, these people are of a lesser quality than in months with lower growth rates. But that wasn’t the case here, which is great news for the client.
While the November bounce rate was higher than September, it was actually lower than October. So, month-over-month, a larger percentage of the new names were deliverable addresses.
The new subscriber open rate for November was also up month-over-month, although it lagged September. So although they added a lot of new names to the list, they didn’t see a significant decrease in the month-over-month rate of these new people opening the newsletter.
The click-through and click-to-open rates for November were the best we saw in this three-month period. This suggests that these names were actually more interested in the content than subscribers added in previous months.
Rounding out the analysis, the unsubscribe rate for November was the lowest by far – just 0.06% compared to 0.3% and 0.5% (with rounding) for September and October, respectively. The fact that such a low percentage of these subscribers asked to be taken off the list bodes well for future performance. They were interested enough in this month’s issue not to immediately remove themselves from the list.
This analysis shows that one way to boost your email performance is to have a consistent list growth strategy, one that adds new subscribers of good quality to your list on a regular basis.
Over the source of these three months, 20% of the email messages went to first-time (new) recipients, while 80% went to people that had received one or more newsletters in the past. Monthly list growth varied from 7% to as high as 24%. A few factors contributed to this variance:
- The incentive offered at opt-in, which changes on a regular basis and is featured prominently in marketing
- Use of email campaigns to lists belonging to sister organizations in some months
- A redesign of the sign-up page, which boosted the completion rate by 350% (read that case study here).
This column was written by Jeanne and originally published by ClickZ on Feb. 6, 2012.