
Have you heard of ‘analysis paralysis?’ Here’s a definition from Wikipedia:
“Analysis paralysis (or paralysis by analysis) describes an individual or group process where overanalyzing or overthinking a situation can cause forward motion or decision-making to become “paralyzed,” meaning that no solution or course of action is decided upon within a nature time frame… An overload of options can overwhelm the situation and cause this “paralysis,” rendering one unable to come to a conclusion.”
As marketers, we have to balance the number of products we present to potential customers. Too few, and you may lose sales because there aren’t enough options; too many, and you may lose sales due to analysis paralysis.
This is why I often test how many ‘product blocks’ to include in an email message to optimize conversions and/or revenue. Here’s a sample product block wireframe (note the green background, same as in the control/test image below) from this email:
In this case study, our starting point was an email from the previous year’s holiday campaign that performed pretty well. The original, aka our control, had a total of nine product blocks from two different product categories. Six were from one product category, and three were from a different product category. As you can see in the image below, the nine were separated into two ‘sections’ by product category.
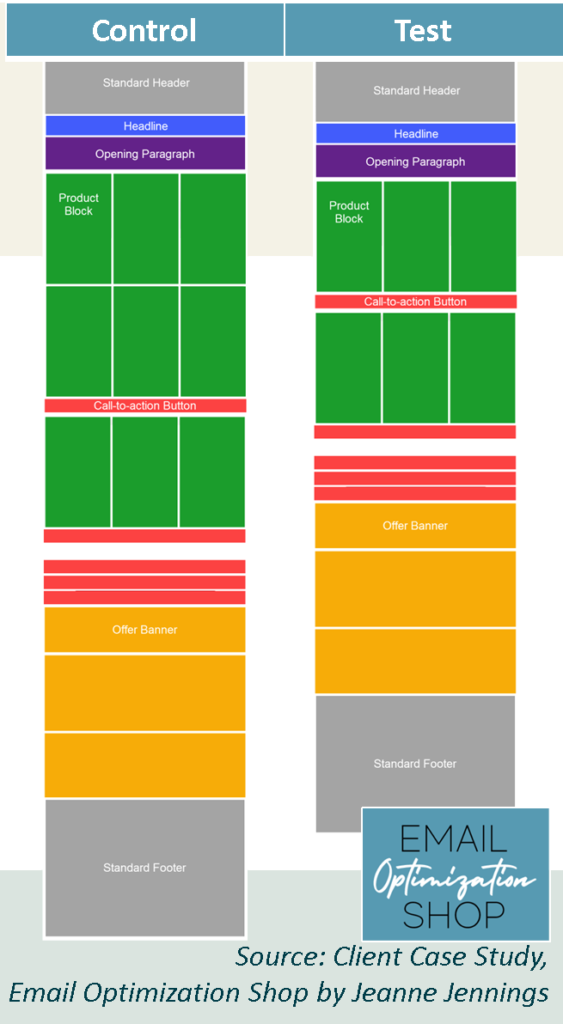
Our test, as you can see in the image above, removed 3 of the products from the first section, so that there were only six product total in the email. The goal here was to increase conversions and revenue by decreasing analysis paralysis.
So which version won? Take a minute and consider which you believe worked better.
Here are the results.
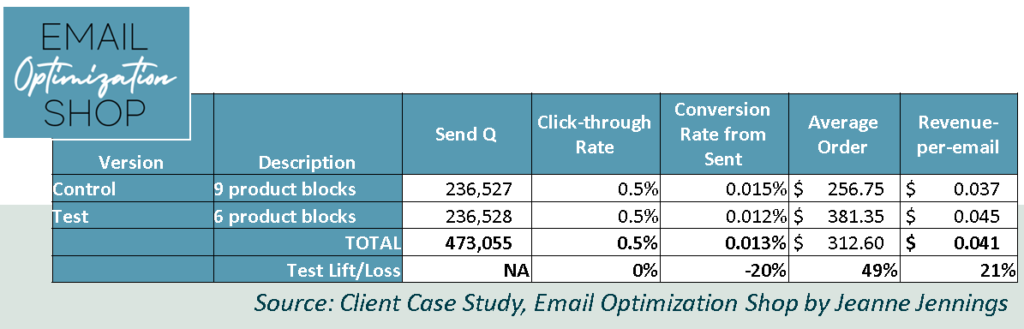
So, was analysis paralysis a factor here? It appears so. The test version, with six product blocks instead of nine, delivered $0.045 in revenue for each email (RPE) sent. This bests the controls’ RPE of just $0.037. That’s a 21% increase in revenue, with the only difference between the emails being the number of product blocks.
We can look deeper to see why the test beat the control.
Although the test generated fewer orders than the control – 20% fewer orders, to be exact – the average order value (AOV) for the test was higher. 49% higher, which is significant.
So, offering fewer choices in the test email caused fewer people to purchase – but those that did purchase from the test spent almost 50% more than those who purchased from the control.
Give this a try with your next email and let me know how it goes!
Feeling overwhelmed? Let’s talk about how I can help you improve the bottom-line performance of your email with strategies and tactics like this one.
And check out this companion blog post about how we generated even more revenue from the test email with a strategic resend!

Photo by Matthew Henry on Unsplash