We’ve all seen them – either right there in your marketing automation interface, or as white papers offered by a variety of ESPs.
Industry Benchmarks.
They proport to tell you how well or poorly your email marketing program is doing.
But here’s the thing; much like those reports on the best day and time to send email, they’re a bit nothing burger.
Here’s why.
None of those other email programs are yours. You don’t actually know how their audience, messaging, frequency, cadence, content, etc. compare to yours. Even if you are in the same industry, that doesn’t mean these things are the same.
There’s a better way.
Leverage your own internal benchmarks.
How to Create Internal Benchmarks for Your Organization
It’s not difficult to calculate your own internal benchmarks. It’s actually quite easy, and these give you an apples-to-apples gauge of your current email performance.
Let’s start with a very simplified example; then we’ll expand on that into more sophisticated internal benchmark territory.
Let’s say this is the raw data from your campaigns:
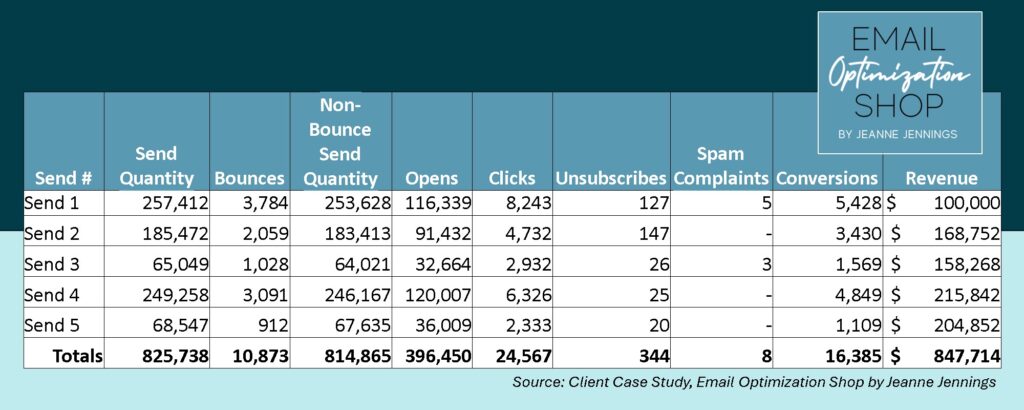
If you don’t have all these columns, that’s okay. Just use the data you have. But it is important to total the columns; we’ll need those totals to create the internal benchmarks.
Next you calculate your email marketing metrics, using your raw data, as we’ve done below using the raw data above.
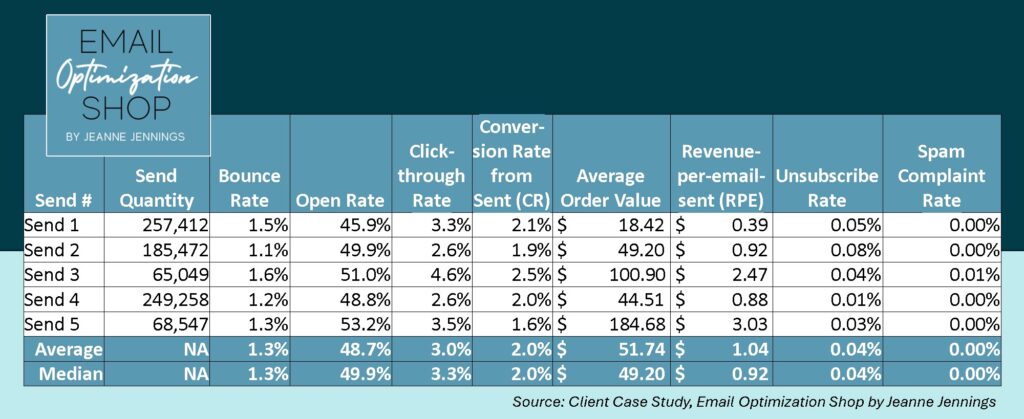
As you can see, we calculated the metrics for each of the sends.
We also calculated the average, or mean, metrics for these sends – this is easy. You use the same formulas you used for each individual send, but the raw data you use is the ‘totals’ line from your raw data calculations.
Pretty easy huh?
I like to take one extra step and look at the median for each metric. This may sound daunting, but it’s quite easy.
The median is defined as the mid-point of the values for each metric.
The manual way to do this is to sort the values from highest to lowest (or lowest to highest) and then identify the mid-point. This is your median.
If you’re using a spreadsheet, like PowerPoint or Google Sheets, the program can do the calculation for you. Here’s how (it’s the same for both):
- Place your cursor in the cell where you want the median to appear
- Type ‘=median(A1:A5)’ and hit ‘return’, where ‘A1:A5’ is the range of values you are using for your median
- You can also use the cursor to highlight the cells with the range of values you are using and then hit ‘return’
Why calculate both the average (or mean) and the median?
Averages can be skewed by very large or very small values – so sometimes the average works, but often you want to use the median as your internal benchmark to adjust for this. An example is below.
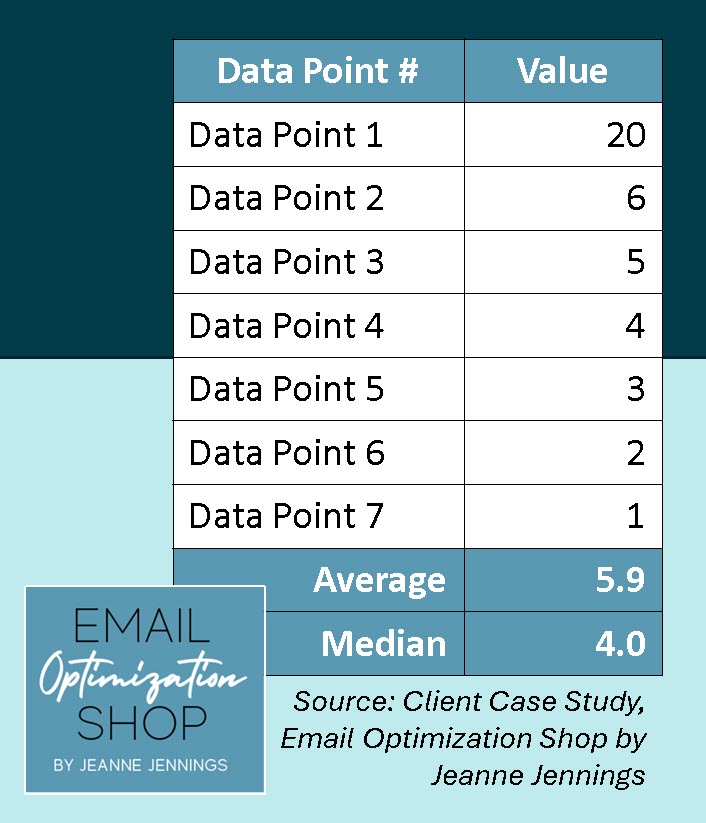
You can see here that the average is nearly 50% higher than the median. This is due to one very high value (20) which skews the average upward. Here I’d use the median as your internal benchmark, as it better represents the average performance of your program.
So that was pretty simple right?
Now let’s talk about adding the complexity you need to make this a useful tool for your program.
Internal Benchmarks by Time Period
It’s not a bad thing to have an internal benchmark that includes everything you send. In order to do that, you just use the raw data from every send within a given period and calculate your average and median metrics as we did above.
I like to calculate internal benchmarks by year, quarter, and month. So, for 2023, you’d have:
- 2023 overall internal benchmark
- 2023 quarterly internal benchmarks for Q1, Q2, Q3, and Q4
- 2023 monthly internal benchmarks for January, February, March, etc.
That’s a good start. But now let’s tailor this to be an even better gauge for your program.
Internal Benchmarks by Type of Email Sent
First I look at the different types of emails sent; for instance, most companies have some mix of the following:
- Promotional sends
- Newsletter sends
- Transactional messages
- Triggered/automated sends
You may have additional types of email messages – that’s fine.
You’ll want to group your sends by type of message – and then calculate your internal benchmark for each type of message.
It’s the same process we described above. And yes you’ll likely want to look at this by time period as well. This will allow you to compare how Q2’2024 performance compared to Q2’2023 – as well as how it did compared to Q1’2024.
Internal Benchmarks by Audience or Segment
Yes, it’s just another way to look at your sends. Perhaps you have different audiences or segments – you’ll want to group the emails you’ve sent to each audience or segment and then use the process above to get internal benchmarks for each.
And yes – if you think it will be useful, you can cross-reference these benchmarks to create an internal benchmark for ‘Audience A, just promotional sends, January 2023.’ More on that at the end.
Internal Benchmarks by Specific Series
Getting even more granular, I’ll often create internal benchmarks for specific triggered email series. So if a company has a welcome series, a reactivation series, a lead generation series, etc. – we’ll benchmark each of them individually. This helps us see how the series is performing over different time periods, but it’s also a great way to benchmark each individual effort or email in the series.
Let’s say you have a series of 5 emails sent over 5 weeks. When you calculate your internal benchmark for the series, you can see which efforts are above – and which are below – that benchmark. And that’s a jumping off point to do some A/B split testing.
Other Internal Benchmarks
You can create internal benchmarks for any metric that you can calculate for your program.
In Conclusion
As you can see, it’s easy to go down rabbit holes here. Just because you can create all these different internal benchmarks doesn’t mean you should. Think about what metrics you’ll actually use and then jump in.
When I have the data, I like to go back and develop internal benchmarks going back 3 to 5 years. This gives us a good historic picture of performance – and it helps us identify the path forward.
Want more information on how to use internal benchmarks? Let me know and I’ll add it to my editorial calendar for future blog posts.
Until next time,
jj

Photo by Markus Spiske on Unsplash