Let’s talk about the email engagement metrics we usually ignore to focus on open and click rates: your unsubscribe and spam complaint numbers.
Yes, I see them too. Sitting there quietly in your dashboard, probably showing up as something like “0.2% unsub rate” or “0.08% complaints.” And if you’re under the industry guidelines (0.5% for unsubscribes, 0.3% (ideally below 0.1%) for spam complaints), you might shrug and move on.
But should you?
That 0.2% unsub rate looks pretty reasonable… until you realize it’s higher than your unique click-through rate.
Uh-oh.
Introducing: The “Unsubscribe-to-Click” and “Spam-Complaint-to-Click” Email Engagement Metrics
These are two new email engagement metrics I’ve started using with my consulting clients to dig deeper into the health of their email marketing programs.
They compare the number of people who took a negative action (unsubscribed or reported you as spam) to the number who took a positive one (clicked).
The formulas are simple:
- Unsubscribe-to-Click Rate = Unsubscribes ÷ Unique Clicks
- Spam-Complaint-to-Click Rate = Spam Complaints ÷ Unique Clicks
Then just multiply by 100 to convert them to percentages.
How to Read These Ratios (a Quick Math Refresher)
Let’s say your campaign had:
- 200 unique clicks
- 54 unsubscribes
Your unsub-to-click rate would be:
54 ÷ 200 = 0.27 → 0.27 × 100 = 27%
That’s under my 50% warning threshold. A 27% unsub-to-click rate means that for every four people who clicked, one unsubscribed. Not great, but not catastrophic.
But what if you had 54 unsubscribes and only 20 clicks?
54 ÷ 20 = 2.7 → 2.7 × 100 = 270%
That means for every one person who clicked, nearly three people unsubscribed.
Ouch.
Every send like that isn’t just underperforming, it’s actively shrinking your list. Not exactly a sustainable strategy.
The Red Flag Email Engagement Metrics Benchmarks
I use these two email engagement metrics individually with clients, and here’s how I interpret them:
- Unsubscribe-to-Click Rate: keep it below 50%
- Spam-Complaint-to-Click Rate: aim for under 10%
Why these numbers?
It’s just a guideline. If for every 10 people who click on your email there are 6 unsubscribes, something is wrong. It could be that better segmentation is needed to increase relevance. Or it could be something else. See more on this below.
In the same way, if for every 10 people who click on your email, By the same token, if for every 10 people who click on your email you get 3 spam complaints, there’s an issue.
Why This Matters (Even If You’re “Within Industry Guidelines”)
You might be thinking: “But Jeanne, my unsub rate is still under 0.5%! That’s within the industry norm!”
Sure. But if that 0.5% is consistently larger than your click rate, then every email you send is eroding your list instead of energizing it.
Think about that for a second.
Even worse, those spam complaints, quietly building up behind the scenes, can tip your sending reputation into the danger zone, affecting all your campaigns, not just the ones causing the complaints.
The Genesis of My New Email Engagement Metrics
Email Quality Score (EQS) isn’t an industry standard (yet?), but it’s one I’ve been watching (and, okay, side-eyeing) for a while. I wrote about it here when it first popped up on my radar. There’s a lot I like about the concept—and a few things I don’t.
Here’s the formula:
EQS = 1 – (Unsubscribes ÷ Unique Clicks)
The idea is to measure whether your email is doing more good than harm.
- A perfect score (with zero unsubscribes) is 1.00
- A score above 0.00 means you had more clicks than unsubscribes
- A score of 0.00 means they were equal
- A negative score? That means more people left than clicked
Not exactly the outcome you’re aiming for.
In the year or so since I wrote that post, I’ve been experimenting with EQS in client reporting. I like what it’s trying to do—balance value and list hygiene. But I’ve also been playing with variations. Tweaks that give a more specific view into what’s actually happening with a send.
That’s what led me to these two new metrics:
Unsub-to-click rate and spam-complaint-to-click rate.
They’re a refinement of EQS.
More granular. More diagnostic. And—if we’re being honest—a lot harder to gloss over.
A Real-World Example: When “In the Green” Isn’t Really Green
Let’s look at a real client case study: one client’s newsletter sends from 2023 and 2024.
At first glance, based on traditional email engagement metrics (unsubscribe rate and spam complaint rate), everything looks good. Here’s that view:
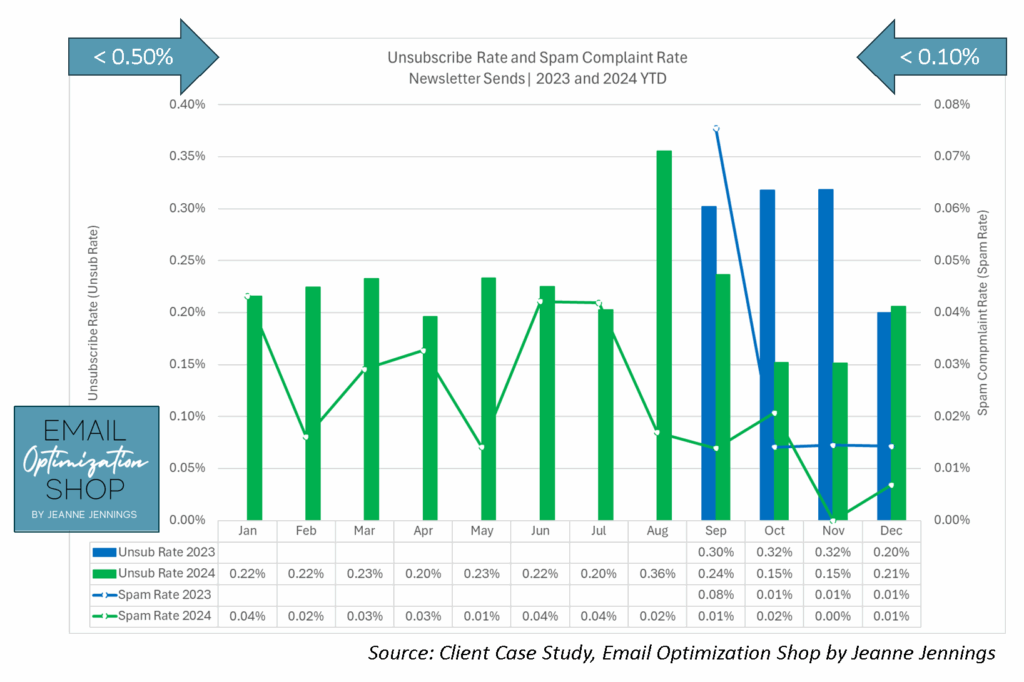
Unsubscribe rates stay well below the industry benchmark of 0.5%. Spam complaints are also comfortably under 0.1%, some months practically hugging the zero line.
Gold stars all around, right?
Not quite.
Now let’s look at those same sends through the lens of unsub-to-click and spam-complaint-to-click ratios. Here’s that view:
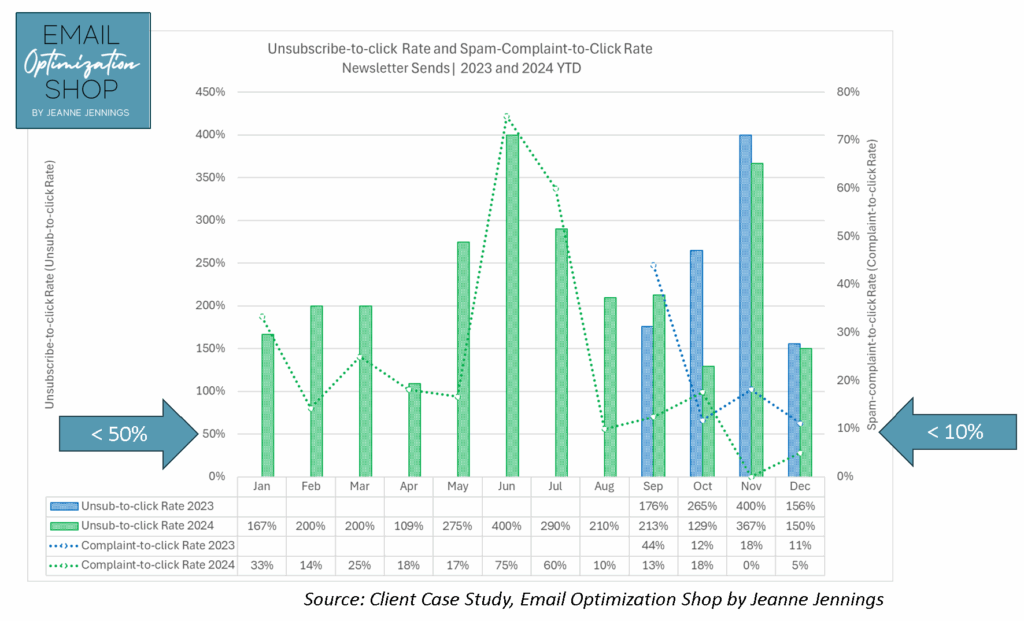
Here we can see:
- In multiple months, the unsub-to-click rate tops 200%. In two cases, it hits 400%. That means for every person who clicked, four people unsubscribed.
- The spam-complaint-to-click rate shows similar spikes: 75% in June, 60% in July, and still above 10% in most months.
So yes, this sender was “in the green” by industry standards. But when we compare value (clicks) to harm (unsubs and complaints), we see that the emails weren’t building relationships, they were eroding them.
These ratios uncovered an issue that standard reporting didn’t: the content wasn’t connecting. Worse, it was actively pushing people away.
And here’s the kicker: This kind of damage isn’t always loud. It doesn’t come with a warning bell. But it can quietly sabotage your list health and even your deliverability over time, especially if mailbox providers start noticing that your messages lead to more complaints than clicks.
What You Can Do
If you’re seeing high unsub-to-click or spam-to-click ratios, don’t panic, but do investigate.
- Check your audience segmentation: Are you sending to people who actually want this content?
- Review your subject lines and preview text: Are you being clear, or clickbaity?
- Audit the content: Is the promise of the subject line fulfilled inside the message?
- Mind your frequency: Are you over-emailing or under-delivering?
And maybe most importantly: ask yourself if the email is actually helpful to the recipient, or just helpful to your internal metrics dashboard.
Bottom Line
Clicks are good.
Clicks that outnumber unsubscribes and spam complaints? Even better.
So next time you review your metrics, take an extra minute to do the math. Are you building engagement, or burning through your list?
And if you’d like a second set of eyes (with a spreadsheet and a strong cup of tea), you know where to find me. Take a look at this metric with your campaign data and let me know what you find!
Until next time,
jj
Jeanne Jennings is the Founder and Chief Strategist at Email Optimization Shop, a boutique consultancy and training organization where she helps clients craft more effective and more profitable email programs.
Learn more at www.EmailOpShop.com and sign up for our free newsletter to get more content like this.

Photo by Scott Rodgerson on Unsplash