“We don’t have tracking set up for revenue or conversions. We just look at opens and clicks. Because the email with the highest click rate probably has the highest conversion rate as well, right?”
As an email marketing consultant and trainer, I hear this a lot.
I get it. It takes time, budget, and resources to integrate Google Analytics or another platform that’s measuring your conversions and revenue with your email marketing platform and/or dashboard. It’s costly.
But the cost of not doing it is probably greater.
The Case Study
Case in point: an A/B split test I did with a client in Q4 2021, as part of a holiday campaign.
The open rate and click-through rate (CTR) results appear in the table below, along with the lift/loss for each test version, using the control as a baseline.
Based on this data, which version performed best to win the test?
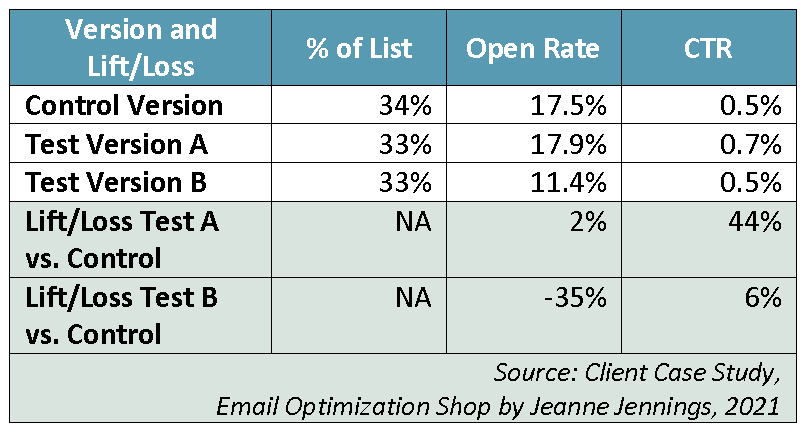
If this is all you have to work with, you’re going to declare Test Version A the winner, since it had the highest CTR. Test Version A generated a 44% increase in CTR over the control.
Open rate and CTR are diagnostic metrics; they give you valuable information about how people engaged with your email, but they don’t directly measure bottom line results. Business metrics speak to bottom line results; a business metric measures the action(s) caused by the email that your business needs to survive.
In this instance, the client is selling products, so their business metrics are:
- RPME, which stands for revenue-generated-per-thousand-emails-sent
- CR from Sent, which stands for conversion rate (here, number of purchase transactions) from the quantity sent, and
- AOV, which is average order value (AOV).
Take another look at the table with these metrics added – is Test Version A still the winner?
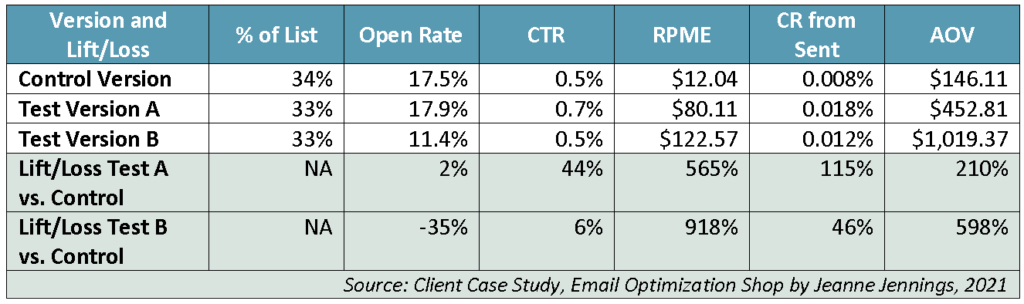
The answer is no. Test Version B is the winner.
Why is Test Version B the winner?
Because it generated a 918% lift in RPME over the control. The control brought in $12.04 in sales for each 1,000 emails that we sent. Test Version B brought in $122.57 in sales for each 1,000 emails that we sent. Test Version B generated 10 times more revenue than the control.
Test Version A wasn’t a slouch; it bested the control version in RPME by 565%. But that was a smaller lift over the control than Test Version B.
Why did we use RPME to determine the winner? Because it’s our key performance indicator (KPI). As with most companies that sell products, we are looking to bring in as much money as possible from each email we send. So, we divide the total revenue we received from each version by the number of email addresses that version was sent to, which is RPME, and compare them.
While RPME is our KPI, we look at other business metrics to get a deeper understanding of the results.
Let’s first look at CR from sent:
- 0.008%, Control Version
- 0.018%, Test Version A
- 0.012%, Test Version B
Test Version A has the highest CR from sent, a 115% lift over the control. It’s still not the overall winner (since we’re looking to maximize revenue, not number of transactions), but there might be learnings here that we can test in the future to try to boost CR from sent on this or other emails.
Now it’s time to look at AOV:
- $146.11, Control Version
- $452.81, Test Version A
- $1,019.37, Test Version B
Test Version B has the highest AOV, a 588% lift over the control. This metric isn’t our KPI, so it’s not why Test Version B is the winner. But it does explain WHY Test Version B is the winner. While Test Version B generated fewer transactions than Test Version A, the revenue generated from each of the Test Version B transactions was much higher.
Skeptical?
“But how often is that true? Maybe that case study was an anomaly. I bet that the email with the highest CTR usually also has the highest RPME.”
I hear you, but…
This case study was, indeed, based on a single send. But over the course of this four-month campaign, we did a total of 14 A/B split tests. When I looked at the 14 winners, the versions with the highest RPMEs, and then compared the CTRs of all the versions in each test, here’s what I found:
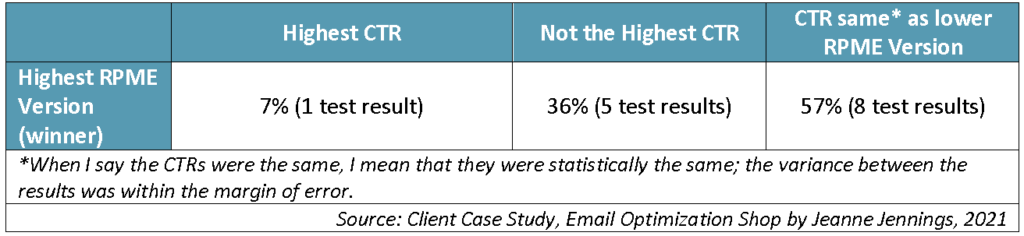
In this case, if we had used CTR as our KPI, we would have been outright wrong more than one-third (36%) of the time – and our results would have been inconclusive more than half (57%) of the time. Only 7% of the time (1 send out of 14) would we have guaranteed we were optimizing RPME by declaring the version with the highest CTR the winner.
This happens more than most people imagine; I have examples where the version with the highest RPME doesn’t have the highest CTR from pretty much every client I’ve worked with during my 20+ years of consulting.
Ongoing Benefit
One more note. When you optimize RPME, it’s not just for the test that you’re currently doing.
The winner of a test should become the new control, so the next time you’re doing a similar campaign that’s where you start.
In the case of the example above, we sent the winning creative (Test Version B) three more times during the four-month holiday campaign. By using RPME as our KPI, instead of CTR, we got the most revenue per email sent out of each of those campaigns as well.
Conclusion
Make sure you always use the best KPI for your email campaigns. This should always be a business, not a diagnostic, metric.

Photo by Will Porada on Unsplash
This post was originally published on the OI Metrics Project website.